
4-Channel Temperature Monitor/Logger Software
Features
- Selectable temperature units (may be different than units display on the monitor LCD)
- Current (last) temperature display
- Scrollable real-time graph at various zoom levels
- Temperature display at sample points on the graph
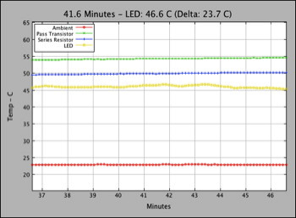
- Delta temperature display capability
- Customizable channel labels
- Save/Open sample data to/from a text file (same format as raw Monitor serial data)
- Print graph
- Copy graph to clipboard for pasting into other documents
Description
The TempMonitor application stores all samples from the monitor device and plots them at various scale factors. It can also read them from a text file. Plot points are identified on the graph when the mouse cursor enters the graph area and information for each sample point is displayed when the mouse cursor is over that point.
The TempMonitor application stores all samples from the monitor device and plots them at various scale factors. It can also read them from a text file. Plot points are identified on the graph when the mouse cursor enters the graph area and information for each sample point is displayed when the mouse cursor is over that point.
File Operations
Open / Save / Save as... : Load or store samples. The last open or save file is displayed in the title bar.
Print Operations
Page Setup / Print : Prints the current graph. Page Setup is only available for the Mac and Windows platform. The graph will be printed with markers and plot point information if the cursor is over the graph when the print command is issued (using shortcut keys).
Edit Operations
Cut / Copy / Paste / Select all : Apply to Graph Trace Labels. The graph itself can be copied (rendered) to the clipboard. Click the cursor in the graph to select it and then Copy (using a shortcut key or the menu item).
Reset Graph : Deletes all samples and clears the graph.
Reset Graph : Deletes all samples and clears the graph.
Serial Port
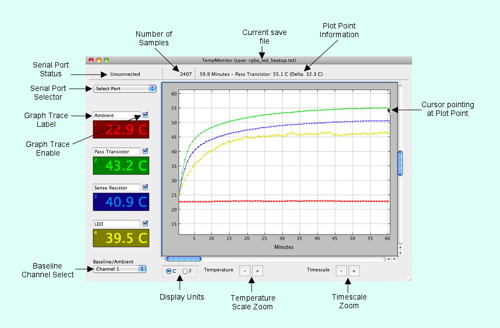
Serial Port Selector / Serial Port Status : Selects and opens a serial port. The Serial Port Selector is populated with available serial ports when the application is first started. Set the "Select Port" entry to close the serial port. The Serial Port Status shows "Unconnected" or "Connected" status.
Display Information
Number of Samples : Total number of samples from the serial port of read in from a file. The number of samples displayed on the graph may be less depending on the Timescale zoom factor.
Graph : The graph displays current sample information scaled by the Temperature and Timescale zoom factors in the selected units. Traces may be individually enabled to be displayed. Plot point markers are displayed on each trace showing the sample when the mouse cursor enters the graph area. Positioning the cursor over the plot point displays information about that sample above the graph. The delta value between the current plot point and the channel designated as the baseline (ambient) may also be displayed. The graph may be scrolled horizontally and vertically using mouse-based scroll wheels or the elevator bars outside the graph.
Temperature : The value of the last sample point (most recent from serial port or last value in a file) is displayed in the selected units.
Controls
Graph Trace Labels : May be customized to identify what is being monitored by that channel.
Graph Trace Enable : Enables display of the associated channel on the graph.
Baseline Channel Select : Identifies a channel to be used as a baseline temperature (e.g. ambient). Enables delta calculations when plot points are selected on the graph.
Display Units : Selects the unit to use when displaying and graphing temperature values.
Temperature Scale Zoom : Selects the zoom level of the displayed Y-axis on the graph (from full-scale to 0.5°C/1°F per division).
Timescale Zoom : Selects the zoom level of the displayed X-axis on the graph (from 10 seconds/division to 30 minutes/division).
Data Format
The application may be used in a stand-alone fashion or with a different serial device.
The data format interpreted by the application is shown to the right (from both serial port and text files). It consists of one sample per line with values separated by one space. It is important to use only one space because of the quick&dirty parsing algorithm in the application. Each line must be terminated with a Linefeed character (0x0A). It may also include a Carriage return character (0x0D).
Timestamp: Integer value; time of sample in milleseconds.
Temp[1:4] : Floating point value; Temperature value in celsius units.
[Timestamp] [Temp1] ]Temp2] [Temp3] [Temp4][LF]
00000000 23.3 35.6 42.5 52.5
00001500 23.3 35.7 42.5 52.3
00003000 23.2 35.7 42.6 52.3
00004500 23.2 35.6 42.5 52.5
00006000 23.2 35.5 42.5 52.4
...
00000000 23.3 35.6 42.5 52.5
00001500 23.3 35.7 42.5 52.3
00003000 23.2 35.7 42.6 52.3
00004500 23.2 35.6 42.5 52.5
00006000 23.2 35.5 42.5 52.4
...
Caveats
- The parsing algorithm is fragile and no validation is performed on text files. So make sure the format of any text files you create match the description above.
- The application stores every sample to enable it to have full resolution at the finest Timescale zoom level. It copies this data into plot arrays every time the graph is updated. This seems to work well on a reasonably fast computers even with hours worth of data. However I suspect that the application would become very slow with days worth of data. Better to modify the application to reduce the sampling rate or implement some sort of adaptive filtering.
- Printing is done at 72 dpi because I was too lazy to deal with scaling everything properly for 300 dpi (or whatever the printer reported back). This seems to produce reasonable output although I noticed it was rougher on linux.
- I develop on Mac OS X and only did a bit of testing on Windows and linux. It's possible there are issues on those two platforms. Let me know if you find something wrong. The more information you can provide, the better.